Land Cover and Land Use Change in Protected Areas
Land Cover and Land Use Change (LCLUC) detection plays a crucial role in land use planning
and development. While numerous studies on Land Use Land Cover (LULC)
have been conducted in various areas, such as specific cities and districts,
LCLUC within protected areas remains underexplored.
A notable study by
Farshi et al. (2016) examined land cover changes to determine
the suitable habitat for Brown Bear in an Iranian protected area.
However, there is a lack of similar studies in other regions.
I, therefore, am leading a research project focused on studying land cover change
in the protected areas of Nepal. We are using a 30-meter resolution LULC map for the
years 1990, 2000, 2010 and 2020 downloaded from
the ICIMOD web portal for analysis.
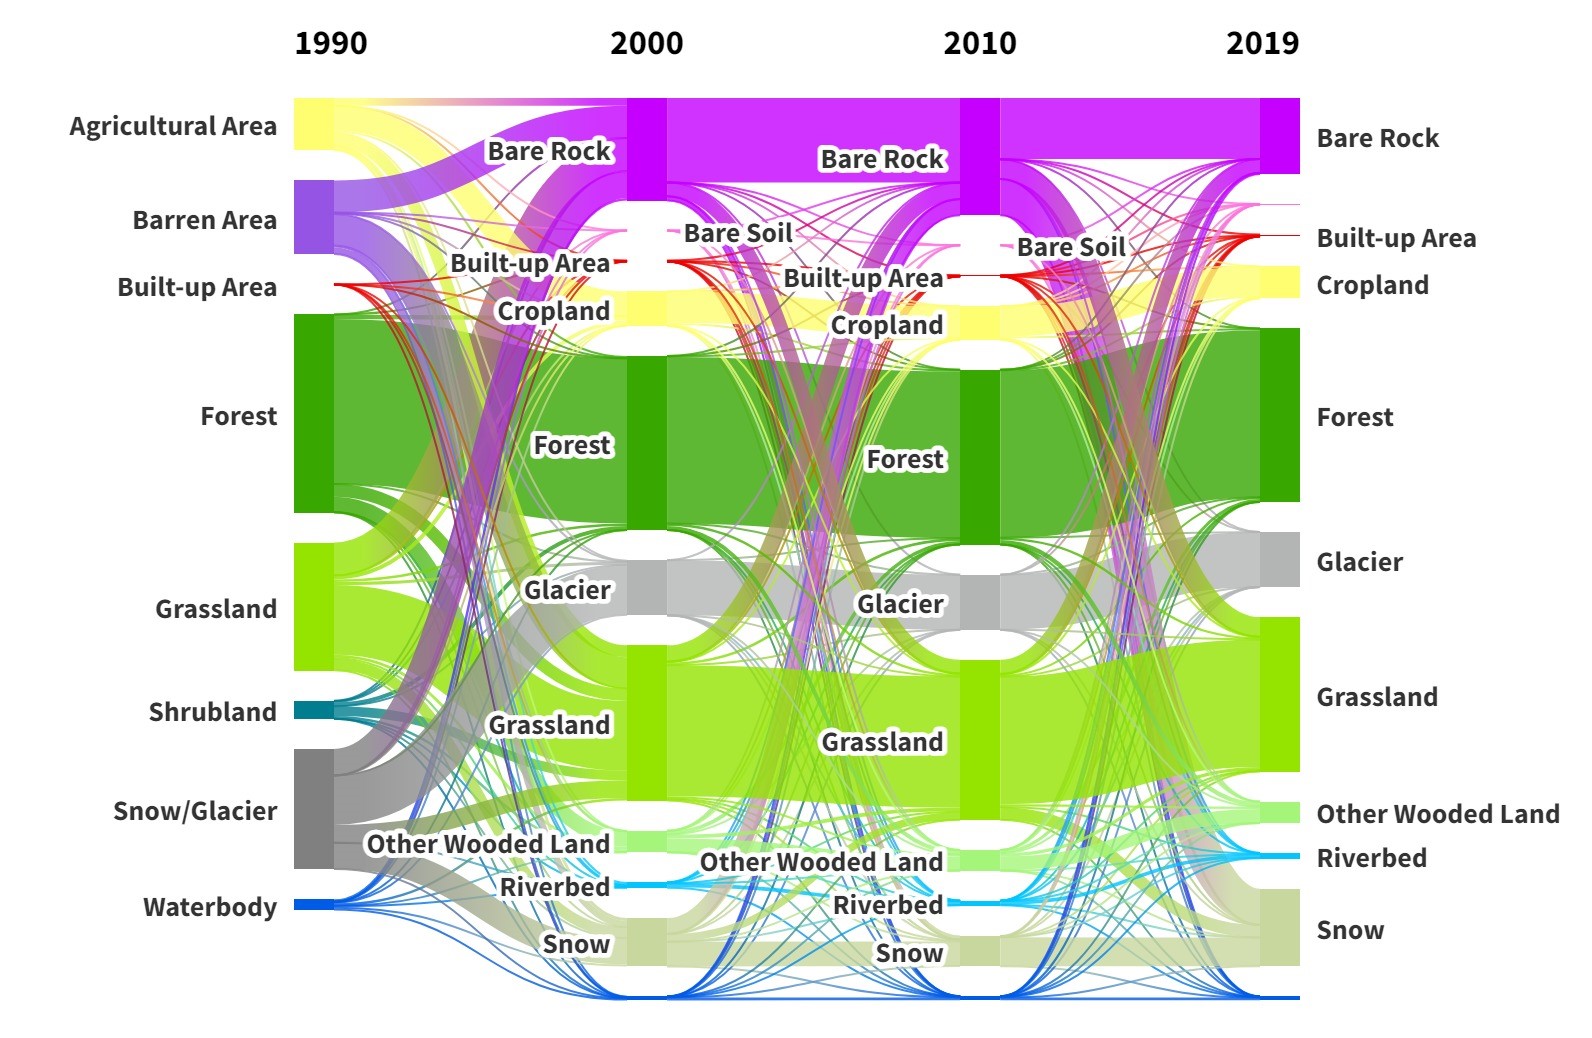
Our study examines LCLUC for the years 1990, 2000, 2010, and 2019.
One of the notable findings was that there is approximately 1800% increase in
built-up areas in the protected areas, which is quite concerning. While, people
generally assume that protected areas do not experience Land Cover change; however,
this is not always the scenario.
Below is the sankey diagram illustrating the change in 30 years time period.
Deforestation Modeling
Deforestation poses a significant threat to biodiversity.
Forests, as vast ecosystems, support a wide variety of flora and
fauna, and their destruction leads to the
loss of these species. In one of my studies, I documented approximately
119 plant species within a 100-hectare area. This signifies the
crucial role played by forests in maintaining biodiversity.
Given the importance of forests, it is essential to study deforestation
in Nepal. Despite an overall increase in forest cover,
understanding deforestation patterns and identifying regions prone
to deforestation are crucial for effective forest and land use management.
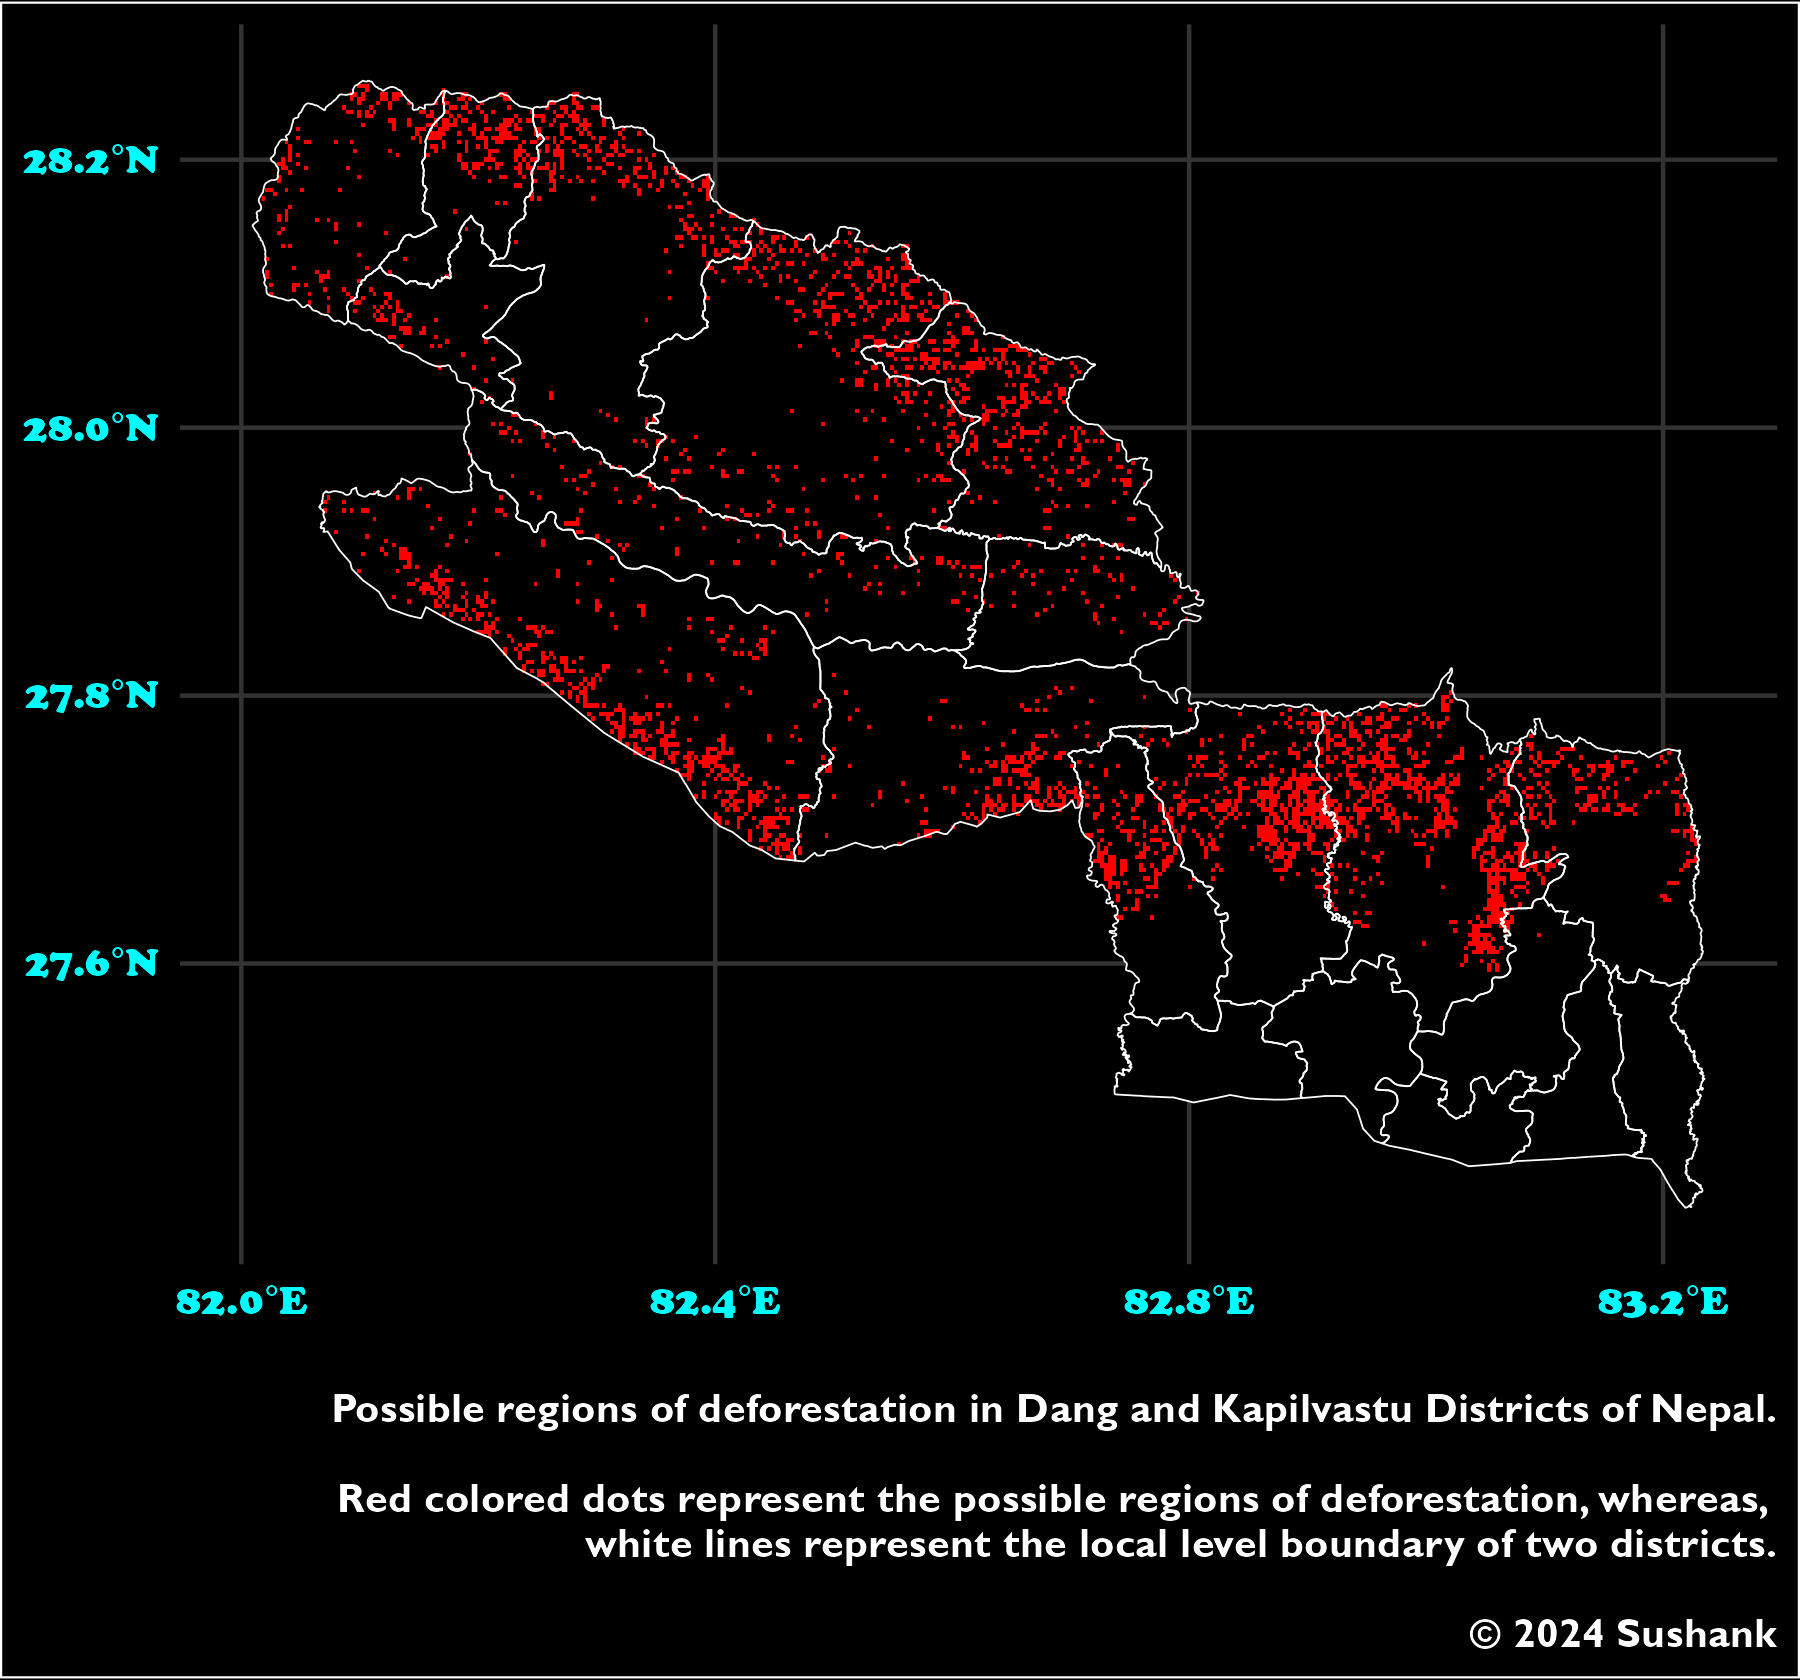
To address this, I led a study modeling deforestation
in two districts of Nepal: Dang and Kapilvastu.
We used Land Use Land Cover maps from 2013 and 2023 to
identify deforested regions. Our model incorporated six
predictor variables: land use, elevation, population
density, and proximity to agricultural land, settlements, roads, and water bodies. We
utilized the 'randomForest' package in RStudio for model building.
This study is an initial phase of a larger project aimed
at modeling deforestation across Nepal.
As we refine our methods, we plan to expand our
analysis nationwide, which will require time and continuous
learning to achieve accurate results.
This study primarily focuses on developing deforestation susceptibility map in the study
area.
Below is the image obtained by performing the modeling, where the red colored pixels
represent the regions prone to deforestation.
Habitat Suitability Modeling of Great Hornbill
The Great Hornbill (Buceros bicornis) is an endangered species in Nepal.
According to the Nepal Bird Red Data Book, it is listed as endangered,
while the IUCN Red List categorizes it as near threatened.
It is also protected under the National Parks and Wildlife
Conservation Act of 1973 and CITES law.
This large bird is found in the Indian Subcontinent and Southeast Asia.
The Chure Terai Madhesh Landscape (CTML), the lowlands of Nepal,
is considered a suitable habitat for the Great Hornbill.
It requires a large area for roosting and nesting, and
the deforestation occurring in recent times has put its existence at risk.
Occurrence points from GBIF and various literatures
were used in modeling the habitat suitability of this species.
I performed the suitability modeling using nineteen bioclimatic variables downloaded
from WorldClim, focusing solely on the CTML.
The result, with a resolution of 1 km, appears quite coarse. The resolution is one of the
limitations of this study as the finest resolution available at WorldClim is approximately 1
km.
I conducted the modeling using the 'sdm' package in R. The suitable habitat was predicted by
five
machine learning models (BRT, MARS, MaxEnt, and RF) and one statistical model (GAM),
which were ensembled together with 20 replications for each model.
All the models showed strong performance, with TSS > 0.7 and ROC-AUC > 0.9.
The Suitable Area majorly lies in Chitwan National Park (central region), Bardiya National
Park and Shuklaphanta National Park
(westernmost region), as predicted by the model.
The map below illustrates the suitable area for the Great Hornbill in the Chure Terai
Madhesh Landscape.

Impacts of COVID-19 on Biodiversity Conservation in Nepal.
COVID-19 had cascading impacts on every sector, including biodiversity conservation.
During the pandemic, there was an observed increase in poaching, illegal hunting of
wildlife,
illegal felling of trees, and firewood collection in many parts of Nepal.
Therefore, a study was conducted to assess the impacts of COVID-19 on biodiversity in Nepal.
A nationwide telephone survey was conducted during the COVID-19 pandemic.
However, due to multiple factors, the study was halted.
After I joined the Society for Conservation Biology-Nepal,
I was tasked with performing Bayesian modeling to study the impact.
While performing Bayesian modeling, COVID-19 cases and active conservation activities
were considered independent variables, selected after a
multi-collinearity test. Factors such as tree felling, firewood collection,
and incidents of forest fires were considered dependent variables.
The changes in these dependent factors before and during the pandemic were utilized in the
modeling.
The study is currently in reviewing process in the journal Forest Ecology and Management
Carbon Stock Comparison of Broadleaved and Coniferous Forest.
Carbon sequestration is one of the key roles played by forests, alongside their economic
benefits. Sequestering carbon is crucial for removing atmospheric CO2 and mitigating the
rate of global warming.
I participated in a study comparing the carbon content in Broadleaved and Coniferous forests
in a subtropical region at approximately 1,300 meters above sea level. The Broadleaved
forest was dominated by Shorea robusta (Sal), while the Coniferous forest was dominated by
Pinus roxburghii (Rani Salla).
We used stratified random sampling to deploy inventory points proportionately and
established circular plots for field data collection. Tree height was measured using a
vertex and transponder, which I used for the first time.
In addition to fieldwork, I performed data analysis and visualization. The primary objective
was to test for significant differences between various parameters of the two forest types,
including tree regeneration and diversity indices. We also compared tree diversity and
carbon stock between the forests.
Our results revealed that the Broadleaved forest had greater tree diversity and carbon stock
compared to the Coniferous forest.